Month-end takes a week
Someone exports reports from three different systems, copies them into one workbook and fixes the formulas that broke since last month.

Nexora connects the systems your business already uses (M-Pesa, your accounting software, spreadsheets, field-survey apps) into one clean database. Then we build the dashboards and reports on top, so they update themselves.
No sales pitch on the call. We ask about your data and tell you honestly whether we can help.
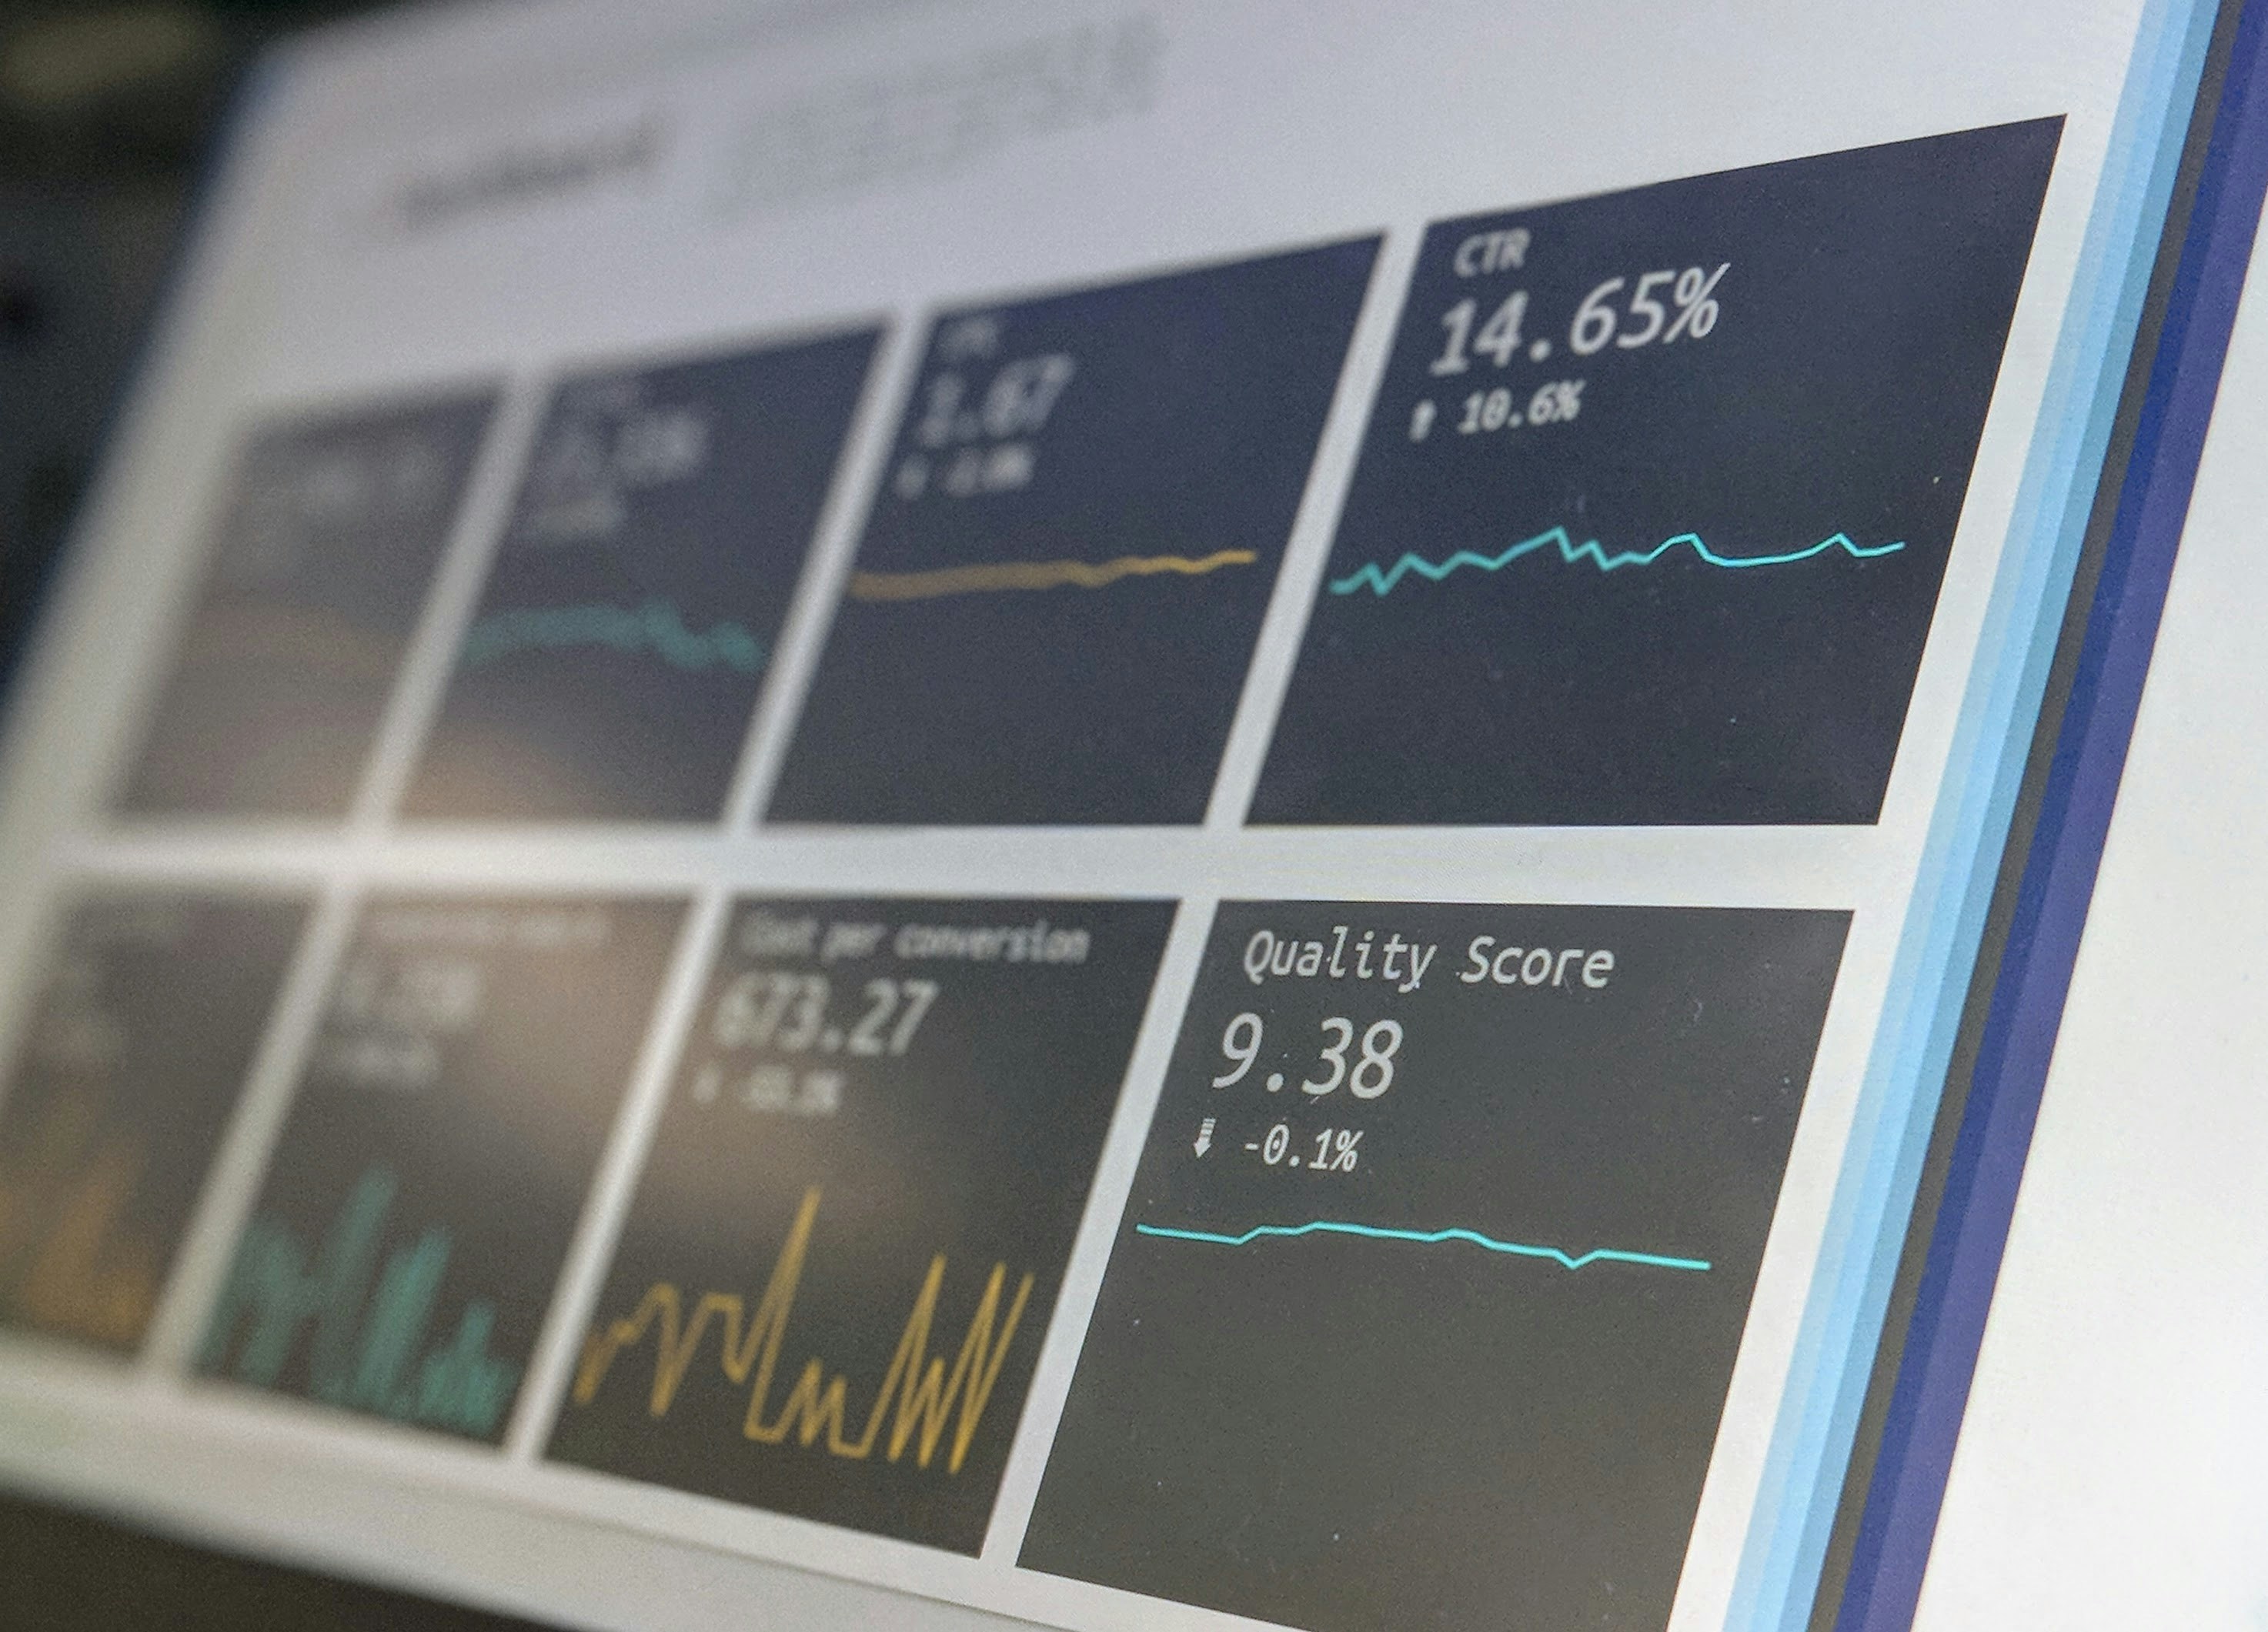
Someone exports reports from three different systems, copies them into one workbook and fixes the formulas that broke since last month.
Sales and finance bring different revenue figures to the same meeting, and the first half hour goes on working out whose number is right.
Orders, visits or surveys are captured on phones, but nobody looks at them until the quarterly report is due. By then it's too late to act.
You're paying for Power BI or a similar tool, but people still ask the analyst to "just send the spreadsheet" because they don't trust the numbers.
Each of these has the same root cause: data that lives in too many places with no reliable process joining it up. That's the part we fix.
Four kinds of work. We usually suggest starting with an audit, and for some organisations that's all they need.
We spend one to two weeks with your team mapping where your data lives, how it moves today, what's broken and what it costs you. You get a written plan with priorities and estimates.
You get: a short report and a prioritised roadmap. It's yours to keep, whether or not you hire us for the build.
We pull data from your sources on a schedule, clean it, and load it into one database, usually PostgreSQL, BigQuery or Snowflake. Every load is tested, so if a source changes or a file arrives broken, we find out before your reports do.
You get: automated daily (or hourly) data loads, tidy tables named after things your business understands, and alerts when something fails.
We agree a short list of metrics with you, write down exactly how each one is calculated, and build dashboards around the questions your team asks every week. Where people prefer a PDF or Excel file in their inbox, we automate that instead.
You get: dashboards in Power BI, Looker Studio or Metabase, a metric glossary, and scheduled reports that send themselves.
Once the data is reliable, we can answer harder questions: how much stock to order next month, which loans are likely to fall into arrears, which customers have stopped buying. We explain the method in plain language, including how much to trust the result.
You get: forecasts or risk scores built into your reports, not left in a one-off notebook.
Your data stays in the systems you already use. We copy it into one database every night (or every hour), and every report reads from there.
Why the middle matters: when sales, finance and operations all read from the same tables, their numbers agree, and adding a new report takes days instead of weeks.
We ask what decisions you're trying to make, which systems you use, and who needs the numbers. If we're not the right fit, we'll say so.
We look at your actual data, not just a description of it, and write up what to build first, what it will cost and how long it will take.
We build in short cycles. Each one ends with something working that your team can use and give feedback on, so there are no surprises at the end.
You get the code, the documentation and admin access to everything. We train your team to run it. If you'd rather we kept it running, we offer a monthly support plan.

We pick the simplest setup your team can maintain. Often that means using a tool you already pay for rather than adding a new one.
Real projects with public code, so you can judge the work for yourself.
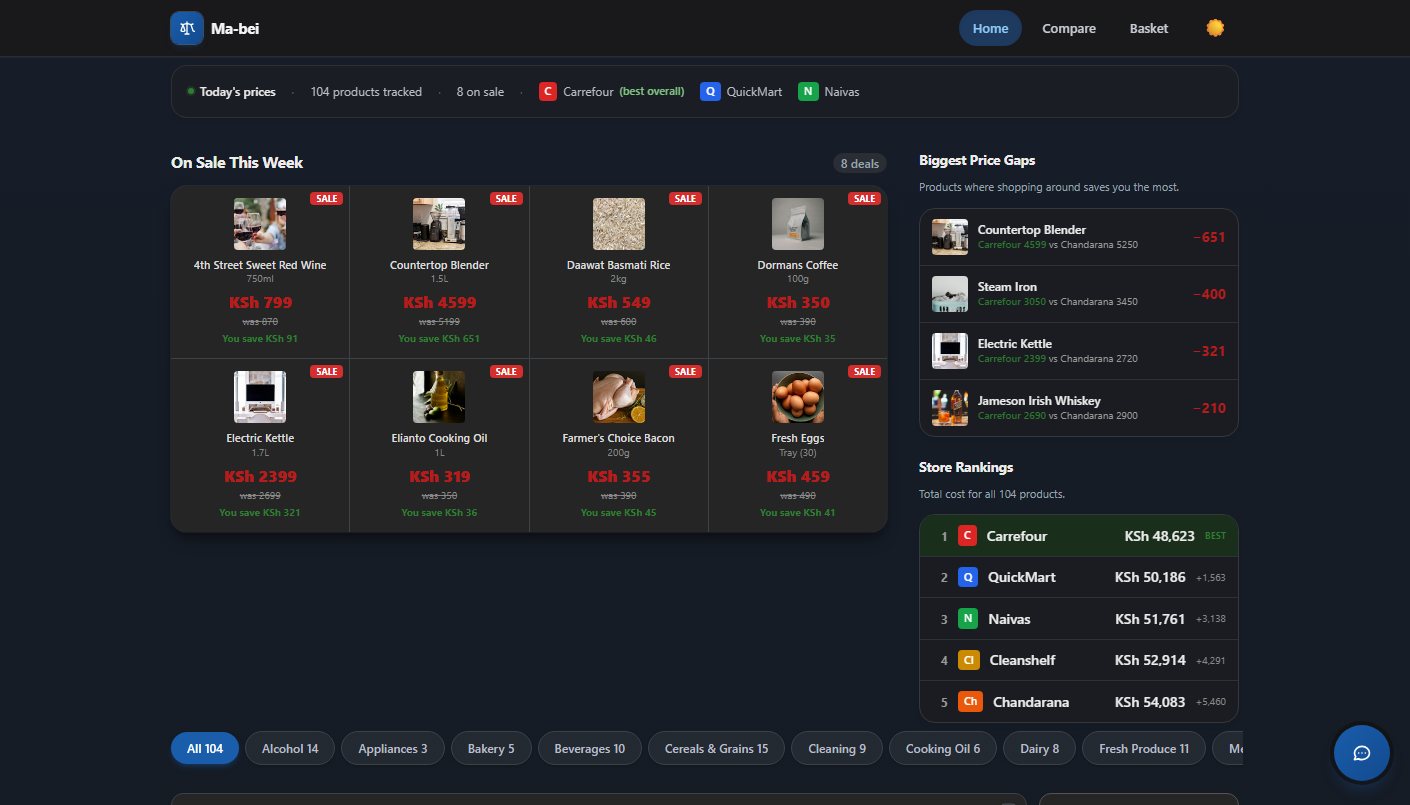
Scrapers collect prices from Naivas, Carrefour and others into PostgreSQL, so shoppers can find the cheapest basket.
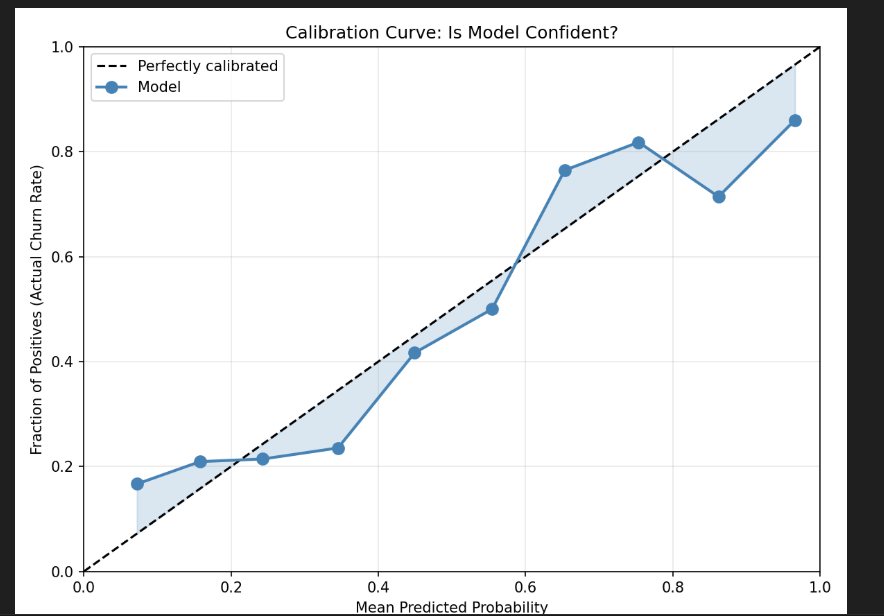
Flags customers likely to leave, with an ROC-AUC of 0.967 and calibration checks so the risk scores can be trusted.
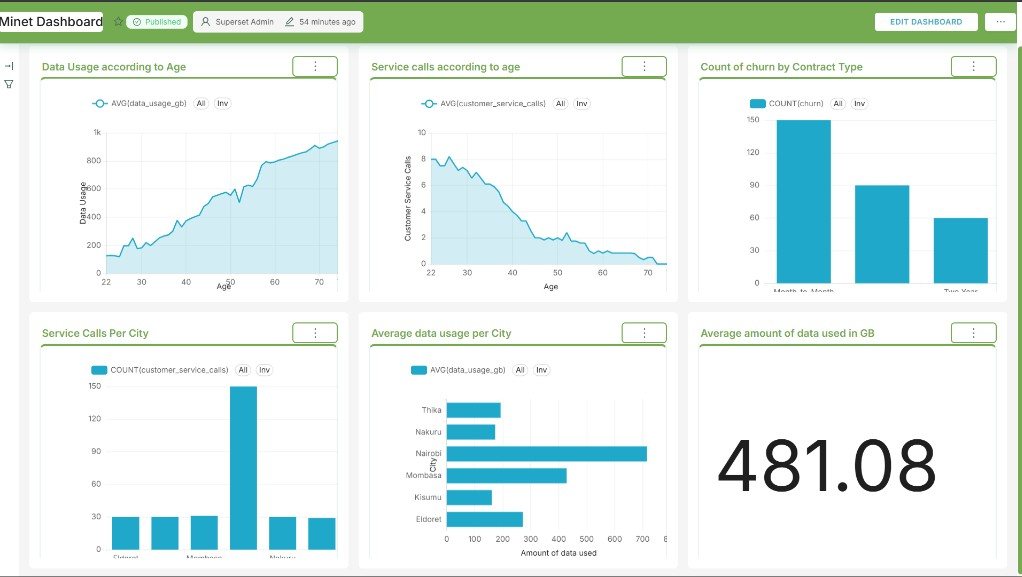
Usage, churn, sales and distribution dashboards built around the questions people actually ask.
Describe the question you can't answer quickly today. We'll tell you what it would take to answer it every day, automatically.