Work

Projects we've built

Pipelines, models and dashboards built by the Nexora team. Most of the code is public on GitHub, so you can see exactly how we work before you talk to us.

01 · Data pipelines

Collecting, cleaning and storing data automatically

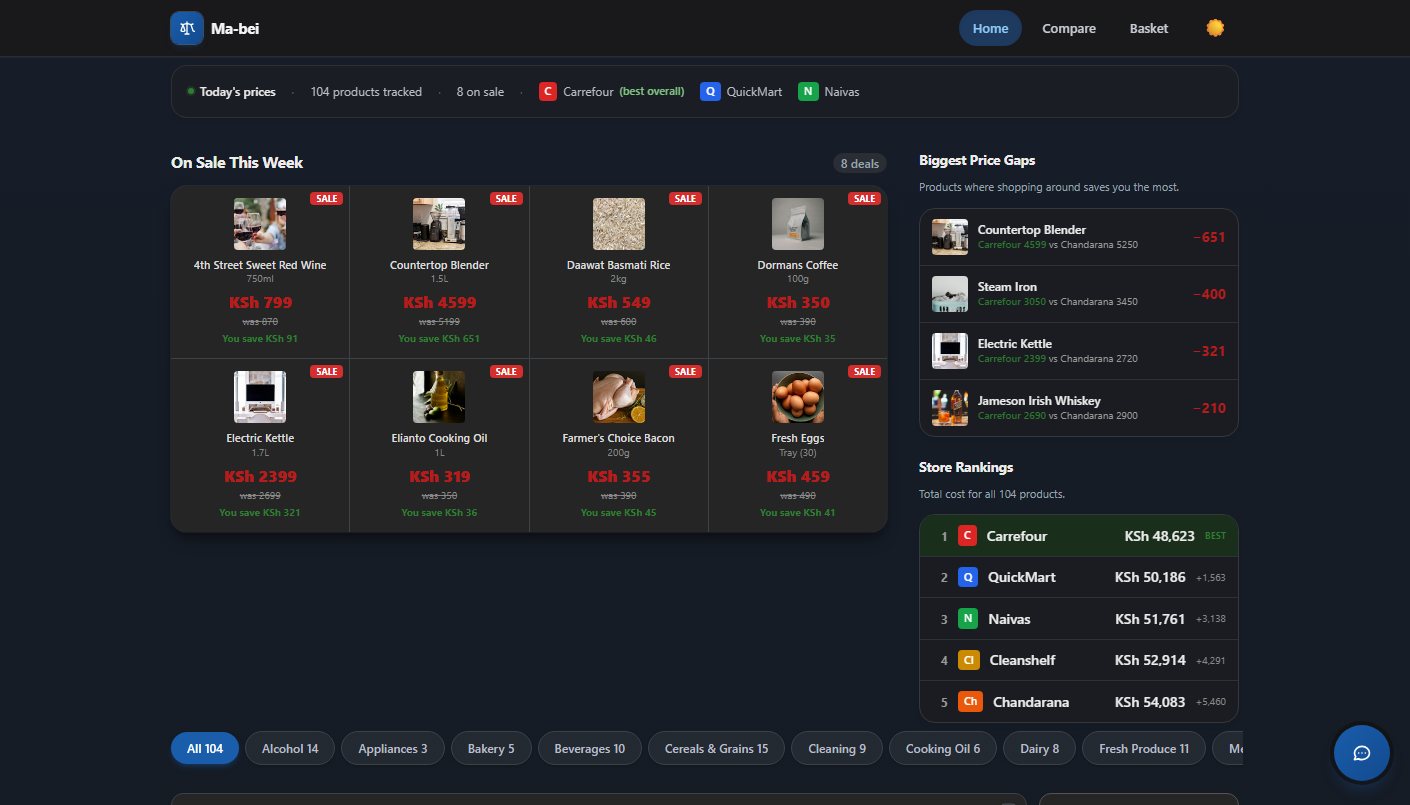
Ma-bei home page showing today's grocery deals, the biggest price gaps between supermarkets, and a ranking of stores by total basket cost
The live Ma-bei site, showing prices collected by the scrapers.
Retail data Live

Ma-bei: grocery prices across Kenyan supermarkets

Ma-bei ("many prices") tracks what the same products cost at Naivas, Carrefour, QuickMart and other Kenyan supermarkets. Shoppers can compare prices, build a basket, and see which store, or which mix of stores, is cheapest.

  • A separate scraper for each store (Naivas, Carrefour, Greenspoon), plus CSV import for prices collected by hand.
  • Scheduled scrape jobs that run in small batches, so each run fits inside a serverless time limit.
  • A PostgreSQL table holding one price per product per store, with sale flags, the original price, the data source and when each price was last checked.
  • TypeScript
  • Next.js
  • PostgreSQL
  • Prisma
  • Scheduled jobs
  • Docker
End-to-end pipeline

Personal data stack

scrapers.py → raw/*.json → dbt → DuckDB → Streamlit

A small, self-hosted version of a company data platform. It collects market prices every day and keeps the full history.

  • Python scrapers pull crypto, stock, exchange-rate and precious-metal prices from four public APIs on a daily timer.
  • Each run is saved as a timestamped snapshot that is never overwritten, so the warehouse can be rebuilt from scratch at any time.
  • dbt staging and fact models in DuckDB, read by a Streamlit dashboard.
  • Failed scrapes are retried three times and trigger an email alert.
  • Python
  • dbt
  • DuckDB
  • Streamlit
  • systemd
Health sector

Medicine data ETL

input/*.csv → validate → PostgreSQL ↳ rejected_rows.csv

Takes medicine stock files in different layouts and loads them into one standard table: name, generic name, manufacturer, batch, expiry, dosage, quantity and price.

  • Rows that fail validation go to a separate rejected file instead of being dropped silently.
  • Output to PostgreSQL, CSV or both, chosen in configuration.
  • Each run produces a data-quality report covering missing values, numeric summaries and top categories.
  • Automated tests, PostgreSQL in Docker, and a simple desktop app for staff who don't use the command line.
  • Python
  • pandas
  • PostgreSQL
  • Docker
  • pytest
02 · Machine learning

Models that are tested, explained and monitored

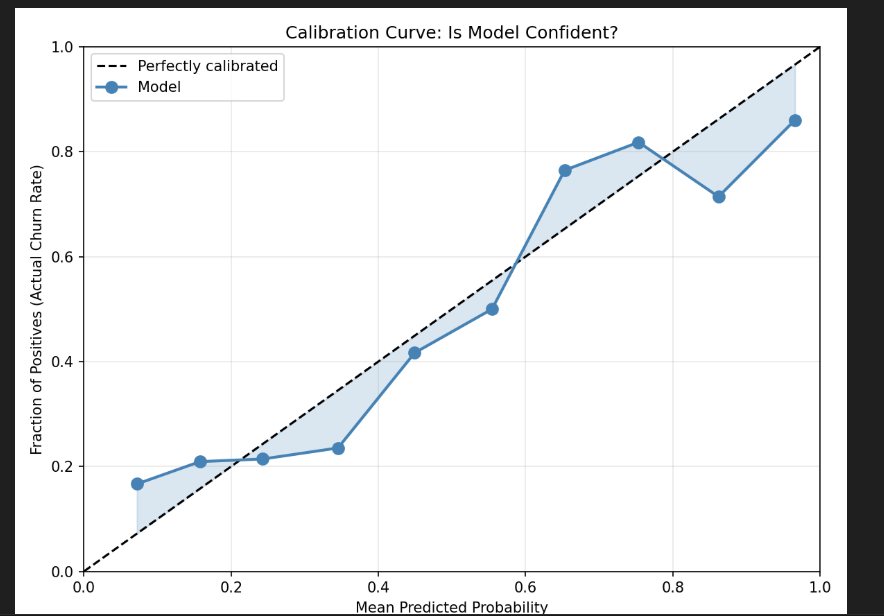
Calibration curve comparing the churn model's predicted probabilities against actual churn rates, close to the diagonal
Calibration: do predicted risks match what actually happens?
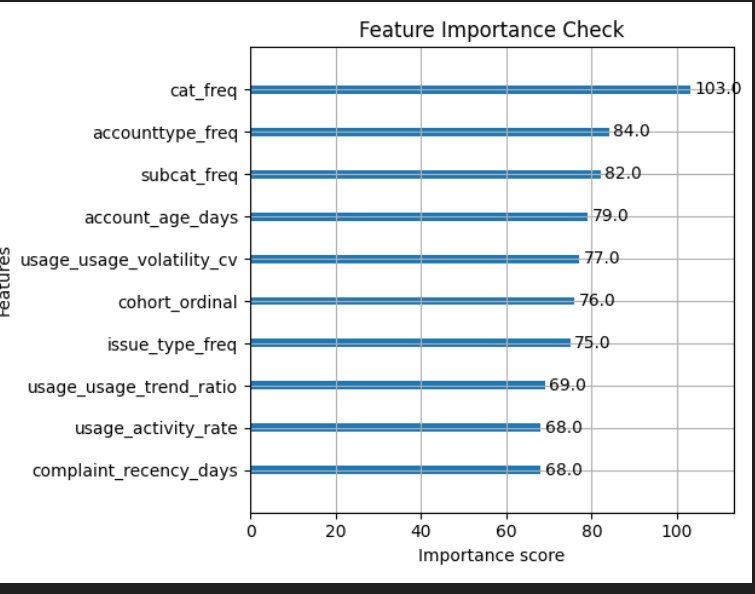
Feature importance chart for the churn model, led by category frequency, account type and account age
Which customer signals drive the prediction.
Customer retention

Customer churn prediction

Predicts which customers are likely to leave, using account history and usage behaviour, so a retention team knows whom to call first.

  • A neural network and an XGBoost model compared using cross-validation.
  • Class balancing, because customers who leave are much rarer than those who stay.
  • Calibration checks and feature importance, so the scores can be trusted and explained.
0.967ROC-AUC
0.894Accuracy
0.844F1 score
  • Python
  • TensorFlow / Keras
  • XGBoost
  • scikit-learn
After deployment

Model monitoring dashboard

Models get worse quietly as the world changes. This dashboard compares recent data with the data a model was trained on and flags when it starts to drift.

  • Data drift measured with PSI, Wasserstein distance and mean shift.
  • Calibration drift (Brier score), precision-recall and ROC-AUC tracked over time.
  • The demo runs on synthetic data with built-in drift. In production it would read real prediction logs.
  • Python
  • Streamlit
  • Plotly
  • SciPy
Insurance pricing

Medical insurance cost predictor

Estimates a person's medical insurance cost from details such as age, sex, region and number of children, packaged as a small web app with a form.

  • Exploration and model training in a Jupyter notebook.
  • The trained model saved and served through a Flask web app.
  • Python
  • Jupyter
  • Flask
03 · Dashboards

Reports people actually open

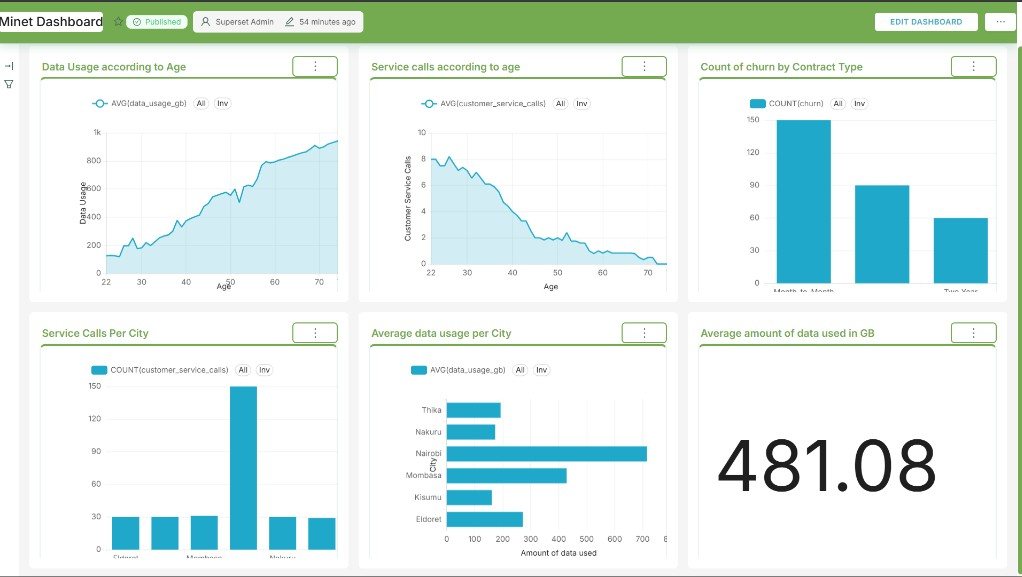
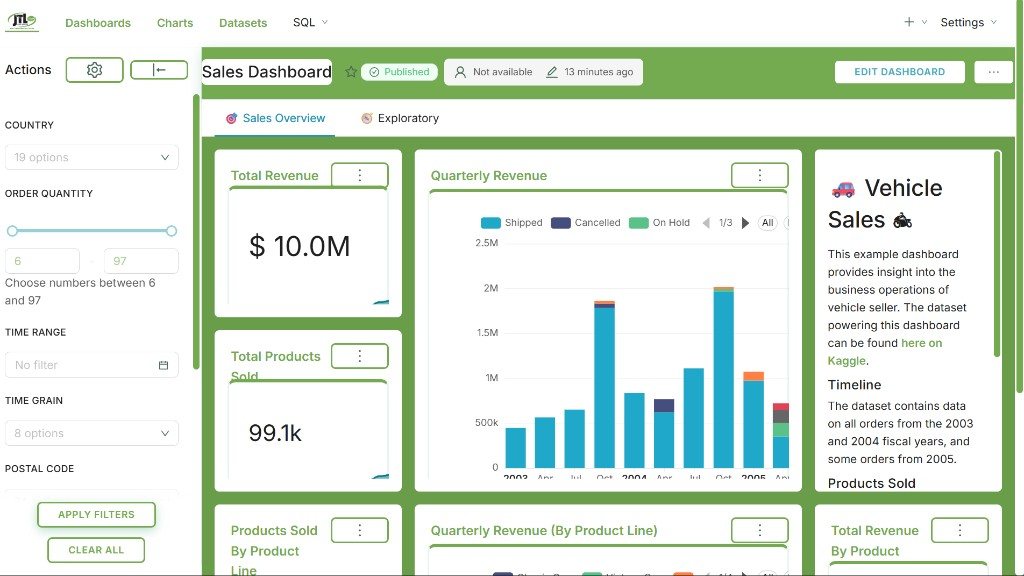
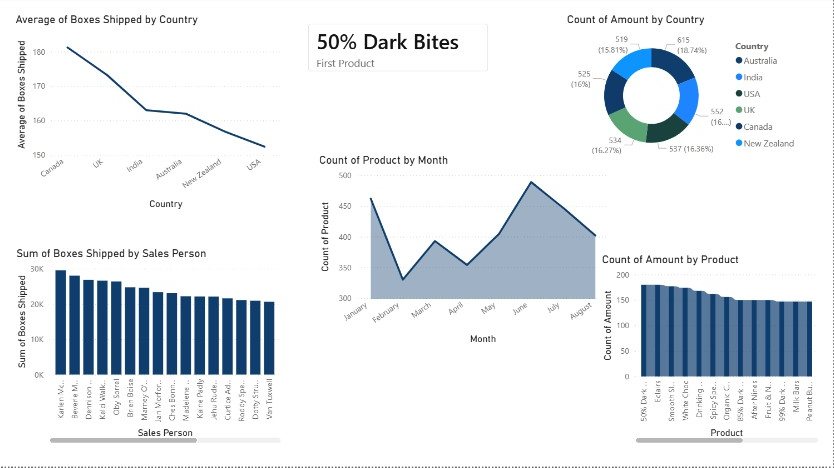
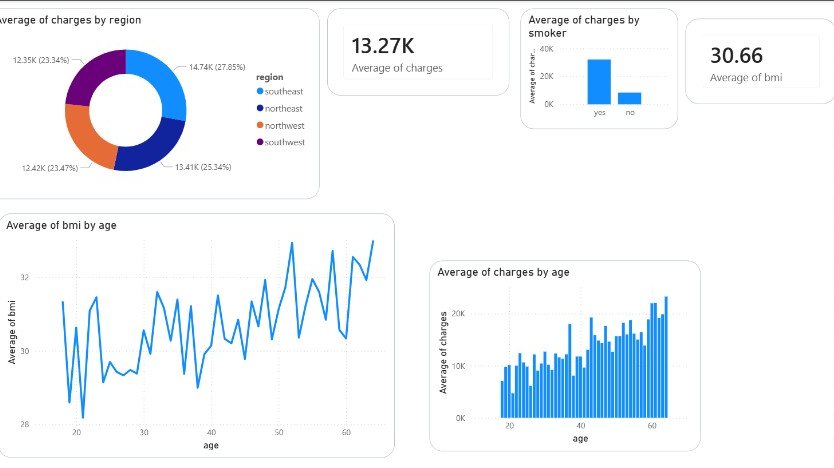
A selection of dashboards built in Apache Superset and Power BI.

04 · What we can build for you

Common problems in Kenyan organisations

Four situations we'd be glad to take on, and what we'd build for each one. These are illustrations of the work, not case studies.

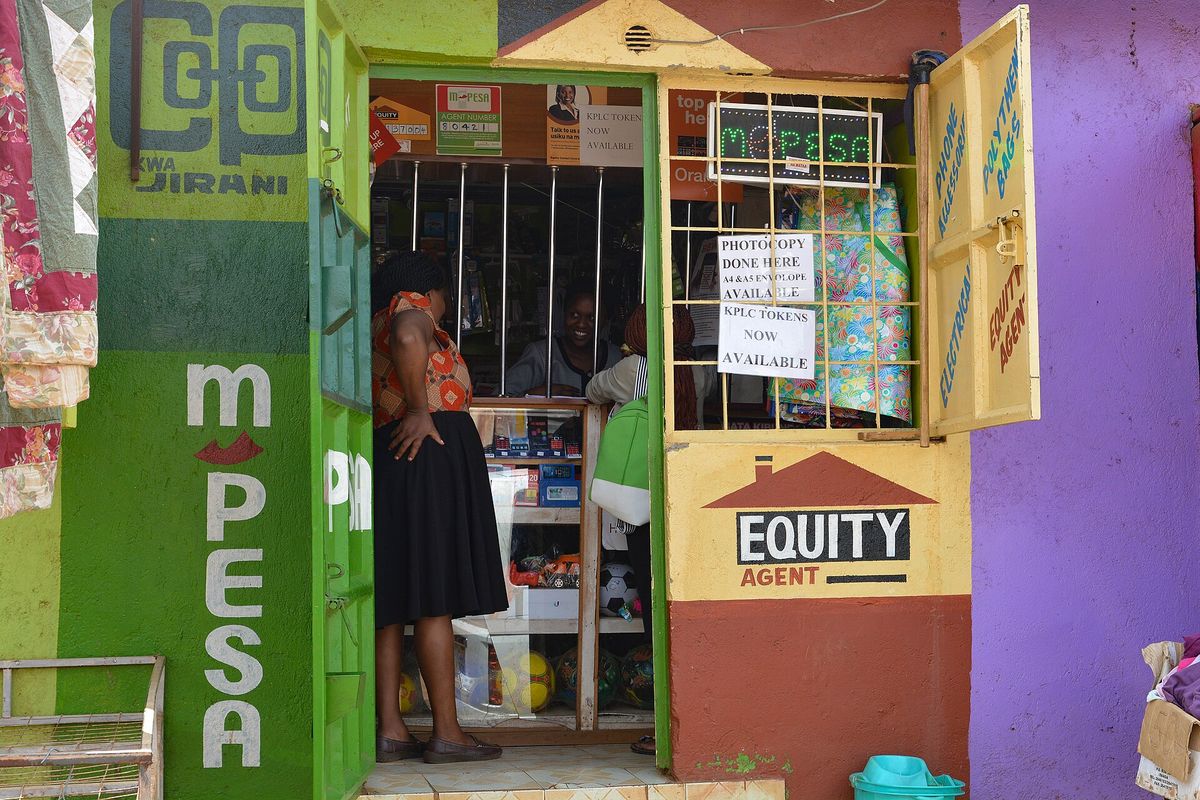
An M-Pesa and Equity Bank agent kiosk on a Nairobi street
Fiona Graham, CC BY-SA 2.0
SACCOs & microfinance

A daily arrears report that builds itself

M-Pesa Paybill repayments matched to the loan book every night, with portfolio at risk (PAR 30/60/90) by branch and loan officer each morning.

  • Daraja API
  • PostgreSQL
  • Metabase
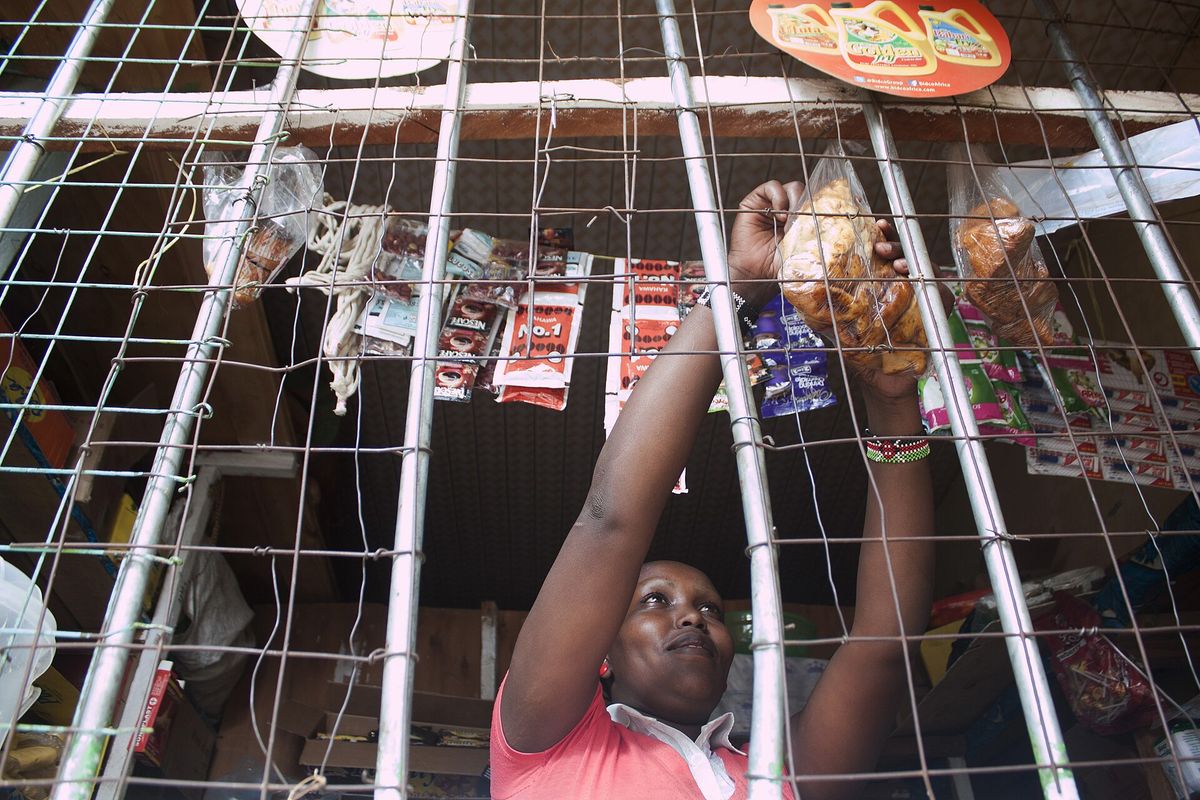
A shopkeeper reaching for stock behind the counter grille of a small Kenyan shop
Isaiah Maghanga, CC BY-SA 4.0
Retail chains

What to reorder, branch by branch

Till data from every branch in one warehouse, one product list across stores, and a weekly demand forecast that produces a reorder list per branch.

  • BigQuery
  • dbt
  • Looker Studio
Two long-haul trucks parked side by side at sunset in Kenya
Isaacgnjoroge, CC BY-SA 4.0
Distributors & wholesalers

Sales by route, without the Monday spreadsheet

ERP orders, M-Pesa and bank payments joined up, giving sales by route, rep and customer, plus a list of customers whose orders are dropping.

  • Odoo / Sage
  • Airflow
  • Power BI
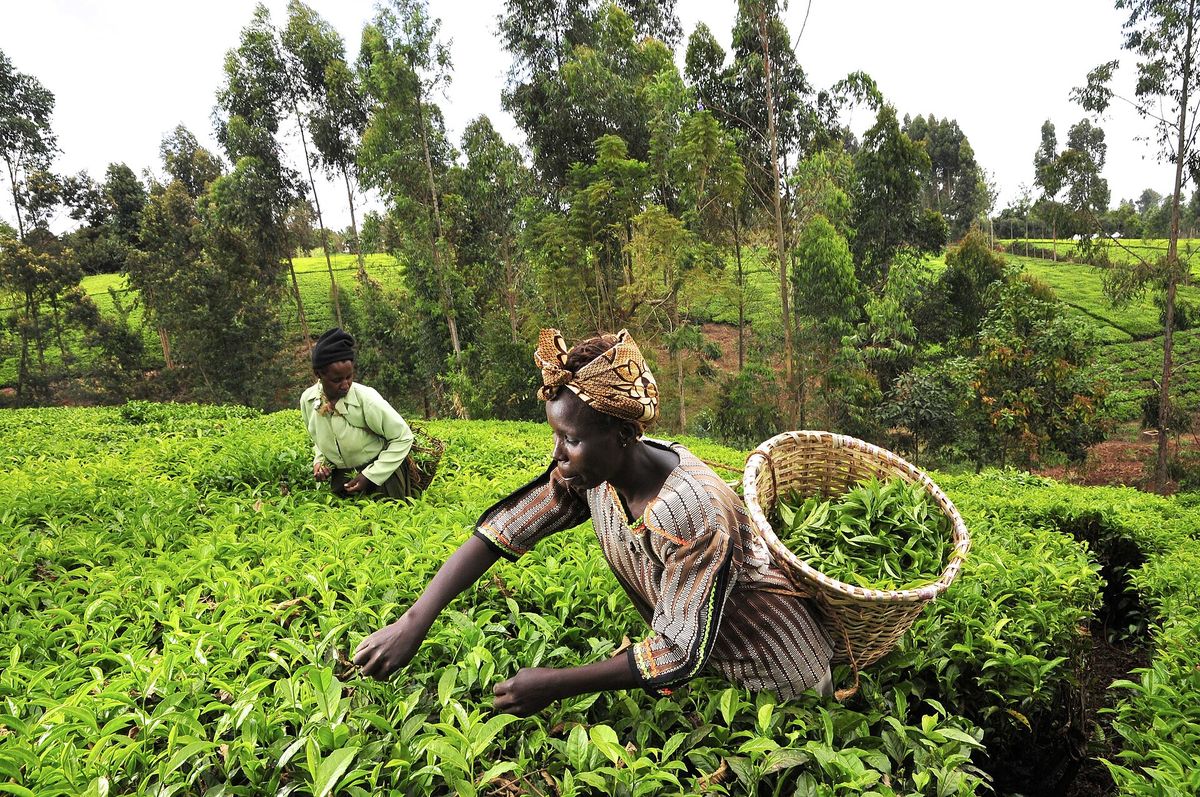
Two women picking tea on a green hillside farm in Kenya
Neil Palmer (CIAT), CC BY-SA 2.0
NGOs & agribusiness

Field survey to donor report in a day

KoboToolbox submissions pulled nightly, checked for duplicates and impossible values, and summarised into the indicators your donor asks for.

  • KoboToolbox API
  • Python
  • Superset

Have a project like one of these?

Tell us what systems you use and which numbers you struggle to get. We'll sketch what a solution would look like on a free 30-minute call.